OpenCOR features demonstration
NOTE: OpenCOR is currently in active development, and this document will be updated to reflect any changes to the software or new features that are added. You can follow the development of OpenCOR at the github project.
This document details some of the features of OpenCOR, a new cross-platform modelling environment that supports CellML. OpenCOR is a plugin-based application that can currently load, run, and simulate all valid CellML 1.0 and 1.1 models. Certain features of the application have been disabled in order to run this simulation demonstration, and these will be described later in the document.
In order to go through this demonstration, you will need;
- the latest OpenCOR snapshot, available from opencor.ws.
- the zip file containing the demo CellML models.
Install OpenCOR, and unzip the package of CellML models.
Running a simple electrophysiology model
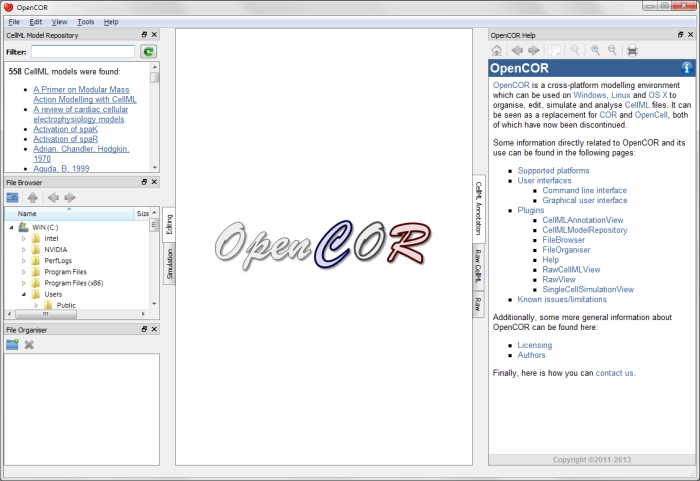
When you first load OpenCOR, it will look something like this:

We do not need the File Browser, File Organiser, Help, or Repository panels for this demo, so we will close them by using the close widgets at the top right corner of each panel. Note that all closed panels can be re-displayed by enabling them in the View menu, or by using the Tools menu Reset All option. All panels in OpenCOR can be moved, undocked and re-docked - this allows you to arrange the interface in the way you find most convenient.
After closing the file panels, go to the File menu and select Open. Browse to the folder where you unzipped the collection of models for this demonstration, and select the hodgkin_huxley_squid_axon_model_1952_original file. Alternatively, you can drag and drop this file into the central area (model editing panel) of the OpenCOR window.
In the Editing window you will see the raw XML of the CellML code. Click on the Simulation tab at the left hand edge of the window to enter simulation mode. You will see three main areas - at the left hand side of the window are the Simulation, Solvers, and Parameters panels. At the right hand side is the graph panel, and running along the bottom of the window is a status area, where status messages are displayed.
Simulation panel
This area is used to set up the simulation settings.
- Starting point - the value of the variable of integration (often time) at which the simulation will begin.
- Ending point - the point at which the simulation will end.
- Point interval - the interval between data points on the variable of integration.
Solvers panel
This area is used to configure the solver that will run the simulation.
- Name - this is used to set the solver algorithm. OpenCOR will only allow you to choose solvers appropriate to the type of problem you are simulating. That is, CVODE or Forward Euler for ODE (ordinary differential equation) problems, IDA for DAE (differential algebraic equation) problems, and KINSOL for NLA (non-linear algebraic) problems.
- Other parameters for the chosen solver - eg. maximum step size, number of steps, and tolerance settings for CVODE and IDA. For more information on the solver parameters, please refer to the documentation for the particular solver.
Parameters panel
This panel lists all the model parameters, and allows you to select one or more to plot against the variable of integration in the graph panel. Note that in the future, OpenCOR will support graphing of any parameter against any other. All variables from the model are listed here, arranged by the components in which they appear, and in alphabetical order. Parameters are displayed with their variable name, their value, and their units.
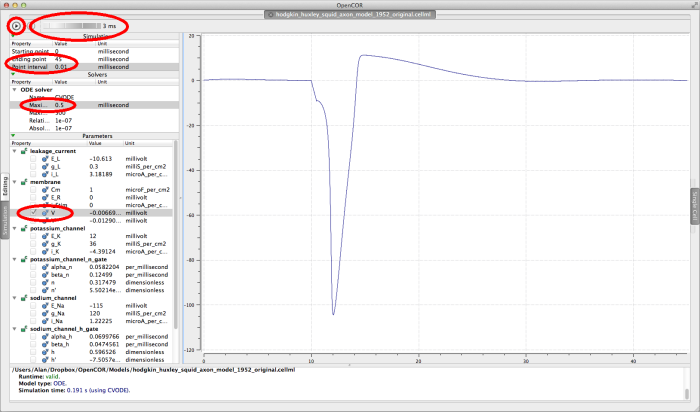
Just above the Simulation panel are controls for running the simulation - there are run, stop, and interval delay controls.
In order to get a useful graph of the simulation of this model, you will need to set some of the simulation parameters;
- set the Ending point in the Simulation panel to
45milliseconds - set the Point interval in the Simulation panel to
0.01milliseconds - set the Maximim step in the Solvers panel to
0.5
Click on the run control now. You will see (depending on how fast your computer is!) a progress bar running along the bottom of the status window. Status messages about the successful simulation will be displayed.
To graph the membrane voltage of the Hodgkin Huxley squid axon model, click in the check box next to the V parameter in the membrane component. If you wish to see the graph being plotted during the simulation, raise the delay control to a few milliseconds, and run the simulation again. You should see a graph like the one shown below.
Running other types of models
The package of models contains a variety of CellML models that demonstrate the range of language features supported by OpenCOR. You can try loading and running these models now.
Note that it is possible to pause a running simulation, alter a model parameter value, then continue the simulation. In this way, you can see the effect of changing model parameters on the output of the model, and directly compare it to the standard parameter graph. See the zhang_SAN_model_2000_all.cellml section for more information.
noble_model_1962.cellml
This is another electrophysiology model, and running it with the default settings will give you a useful graph when selecting membrane/V to be plotted.
import_mode_main.cellml
This is a simple sine model using the import features of CellML 1.1. The import element allows a model to use elements of another model. This enables re-use of existing model components, for example membrane channels or reactions that have already been coded up in other models. For more information on modular modelling using CellML 1.1, see the tutorial on modularity, or download one or both of the CellML 1.1 tutorials on the tutorials page (note - these tutorials still use the old OpenCell application).
simple_dae_model.cellml
This is a simple demonstration of DAE models.
parabola_as_dae_model.cellml
This is another DAE model, but this one also requires a non-linear algebraic solver.
zhang_SAN_model_2000_all.cellml
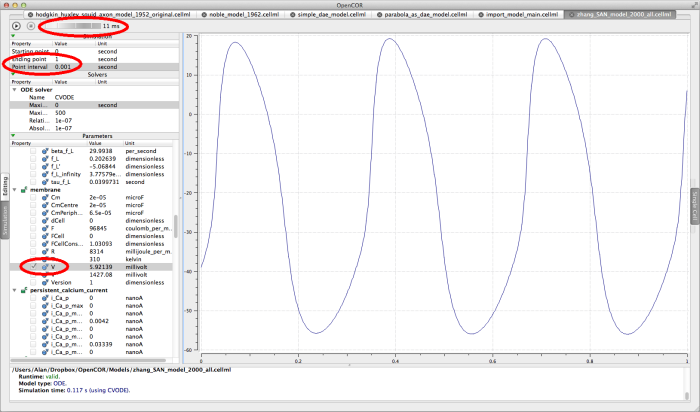
This is a model of action potentials in the rabbit sino-atrial node. The appropriate simulation settings for this model are an end point of 1 second, and an interval of 0.001 seconds. Graph the membrane/V parameter.
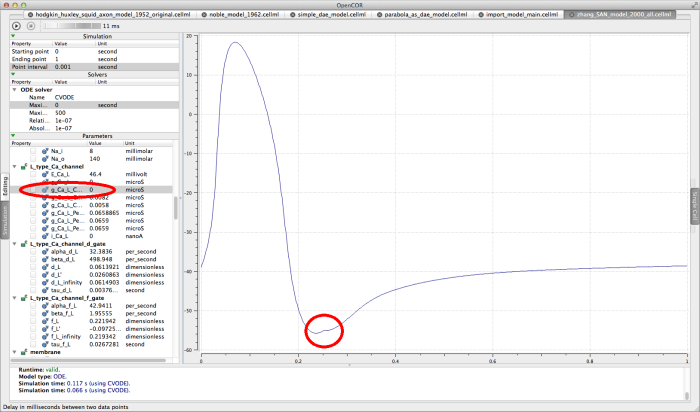
Try running this model with a large interval delay (10-20 milliseconds, for example) and pausing the simulation when the action potential is about to depolarise again . Now edit the L_type_Ca_channel component parameter G_Ca_L_Center0DCapable, changing the value to 0 microsiemens. This essentially blocks the L-type Ca2+ channel, hence "killing" the cell in the simulation. Resume the simulation by clicking run again, and the rest of the graph will show no further action potentials, as show below.
The Zhang 2000 model run for 1 second.
The Zhang 2000 model interrupted and "killed"
Other OpenCOR features
In this snapshot, the following functions of OpenCOR were temporarily disabled:
- Search and listing of models in the Physiome Model Repository (plugin)
- Built-in help system (plugin) - help is available at opencor.ws
- Model annotation (plugin)
- Multiple graph panels
The snapshots available for download at opencor.ws are being regularly updated, so keep checking for the latest versions. To obtain the source code and report issues, go to the github project.


